Poland's GDP divided into voivodeships. New data from the Central Statistical Office [TABELA]

Poland's regions show clear differences in terms of economic development, which is mainly reflected in the dominance of several voivodeships responsible for more than half of the national GDP. These disproportions are also visible in infrastructure and investment attractiveness.
The rest of the article is below the video
Poland's GDP. Five regions constitute the strength of the economy
“In 2024, more than half of the national gross domestic product was generated in five regions: Warsaw Capital, Silesia, Greater Poland, Lower Silesia and Lesser Poland” – according to a report published on Tuesday by the Central Statistical Office (GUS).
See also: “The Polish economy operates at two speeds.” The number of insolvent companies has increased
All regions saw an increase in gross domestic product at current prices compared to 2023, with the largest in the Lublin region – by 9.2%. , and the smallest in the Silesian region – by 3.6%.
The shares of individual regions in generating GDP in 2024 varied significantly – from 2%. in the Opole region to 18.5 percent in the Warsaw Capital Region.

|
Central Statistical Office
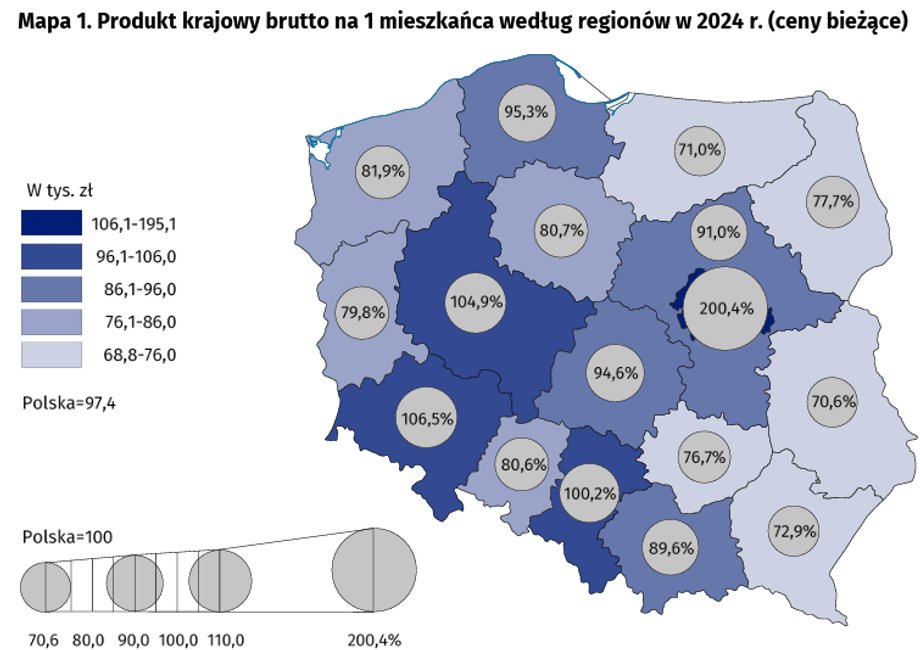
Poland's GDP per capita. New Central Statistical Office data from regions
The value of GDP per capita in 2024 ranged from PLN 68.8 thousand. PLN in the Lublin region (70.6% of the national average) to 195.1 thousand. PLN in the Warsaw-Capital Region (200.4% of the national average).
See also: The Polish economy outperforms other European countries. Which ones overtook us?
The highest level of GDP per capita achieved in 2024 in the Warsaw-Capital Region was almost three times higher than the value of GDP per capita in the Lublin region, where the lowest level was recorded.
|
Central Statistical Office