
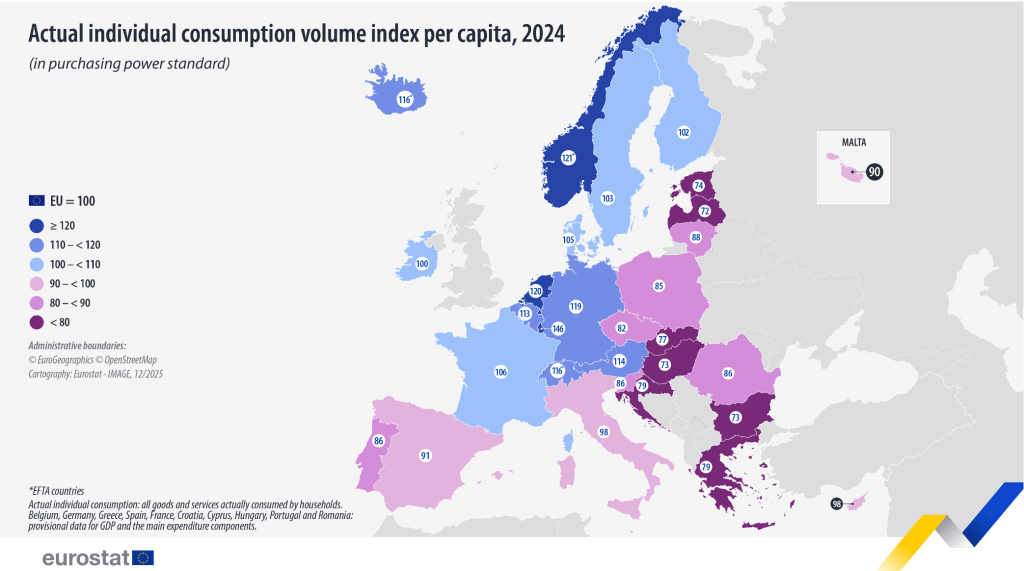
In 2024, levels of real individual consumption (AIC) in EU countries ranged from 72% to 146% of the EU average, which is set at 100, Eurostat notes. AIC per capita is expressed in purchasing power standards (PPS) and is used as a measure of the material well-being of households. Actual individual consumption (AIC) is an indicator that measures what people actually consume, not just what they pay directly out of pocket.
Romania is in a comfortable position, only 14 percentage points away from the European average. Hungary and Bulgaria are 27 pp away from the European average, according to Eurostat.
In Romania, GDP per inhabitant (PPS): ~ 75–78% of the EU average, while effective individual consumption (AIC, PPS) is at 86% of the EU average. Romania is noticeably better at AIC than at GDP.
Consumption is supported by savings, credit and transfers. Also, prices are still lower than in the West.
Even adjusted for PPS, Romania remains a country with lower prices for services, rents and some basic goods. With the same “adjusted” euro, Romanians can consume more physical volume.
Jjournalist Dan Popa sends the “EconoMix” newsletter every Thursday morning. If you are interested in personal finances and want to receive economic recommendations, you can subscribe here:
In short: AIC = the goods and services that households actually benefit from, regardless of whether they are paid directly by the population or by the state / NGOs.
What does actual individual consumption (AIC) include
What households pay out of pocket: food and drink, clothing and footwear, cost of living – rent, utilities, maintenance, transport, fuel, restaurants and hotels or Personal Services.
What the state pays for the population: health services (public hospitals, consultations), education (schools, universities), social and care services, some social assistance services.
Even if health or education is “free” at the point of use, it falls under AIC, because people actually consume it.
Why Eurostat uses AIC and not GDP per capita
Eurostat prefers AIC per capita (in PPS) when comparing living standards between countries, because GDP per capita shows where income is produced, while AIC per capita shows what actually goes to people.
Example: Ireland has a very high GDP per capita (influenced by multinationals). But the AIC per inhabitant is much lower, closer to everyday reality.
Countries with strong public services (France, the Nordics) show better AIC than direct household expenditure.
How Eurostat publishes the indicator
Eurostat usually presents AIC as AIC per inhabitant, adjusted by PPS (purchasing power standard). The EU average is considered 100.
Thus: an AIC of 85 means that consumption is 15% below the EU average. An AIC of 120 means consumption is 20% above the EU average.
Last year, 10 countries recorded an AIC per capita equal to or above the EU average. Luxembourg was the leader, with a level 46% above the EU average, followed by the Netherlands (20% above) and Germany (19% above).
The lowest levels of AIC per capita were recorded in Latvia (28% below the EU average), Bulgaria and Hungary (both 27% below).
Larger differences in GDP per capita than actual individual consumption
Gross domestic product (GDP) per capita in PPS, a measure of economic activity, also showed substantial differences between EU countries, with 10 recording a GDP per capita above the EU average.
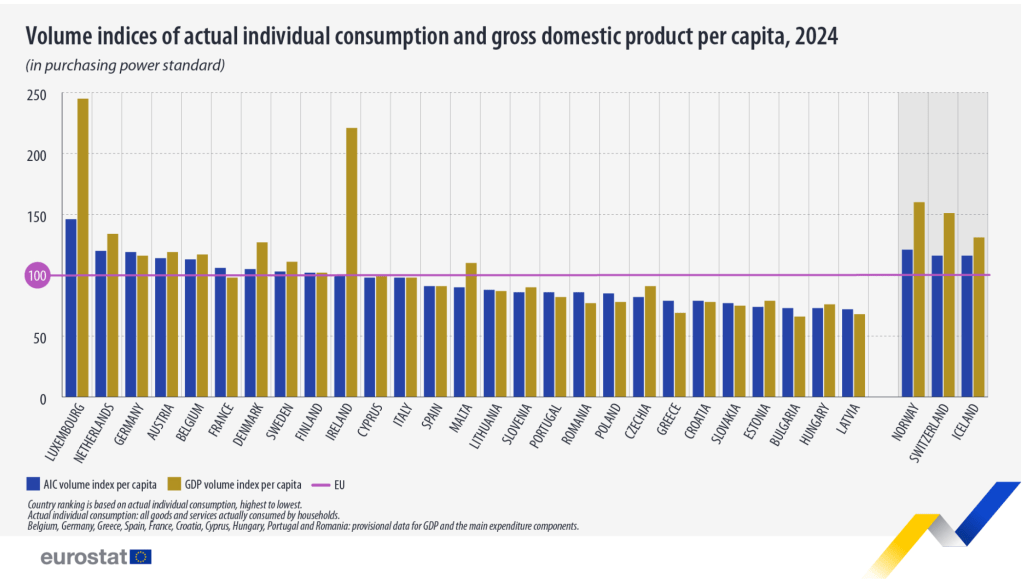
The highest GDP per capita was recorded in Luxembourg (245% of the EU average), Ireland (221%) and the Netherlands (134%). At the opposite pole, the lowest GDP per capita was recorded in Bulgaria (66% of the EU average), Latvia (68%) and Greece (69%).