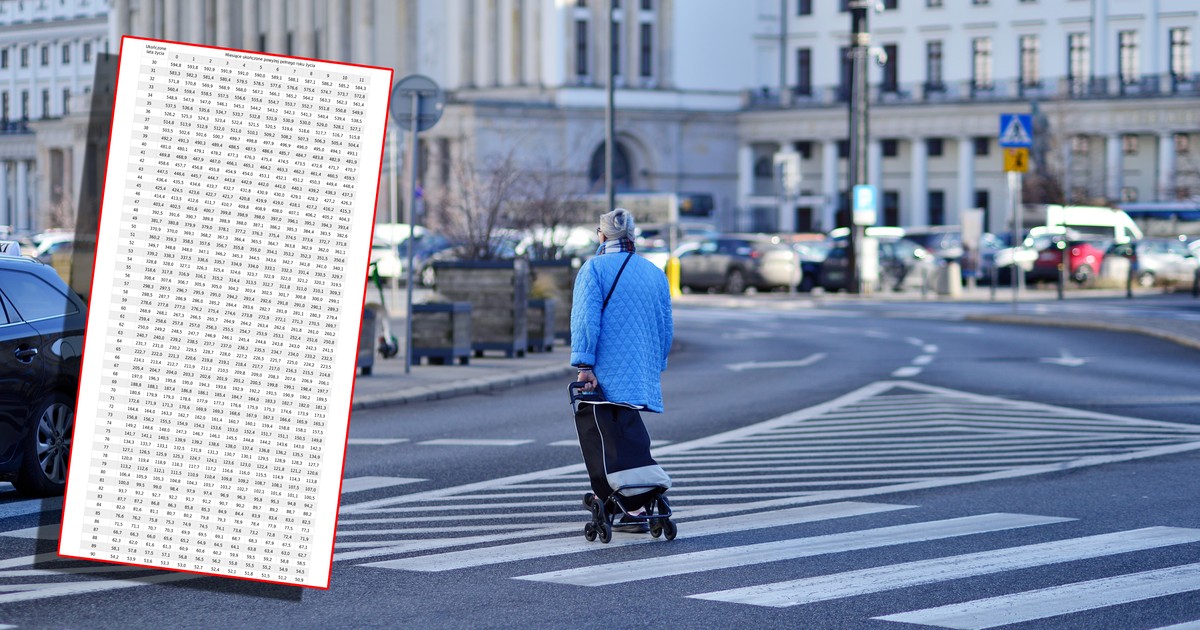
The parameters of average life expectancy included in the table below (for men and women combined) are announced at the end of March each year and are valid for the next 12 months. They are used by the Social Insurance Institution to determine the amount of the pension.
See also: He wanted a free loan and got a big bill. A story that makes you think
The new tables show a clear trend of life extension in Poland.
Table of average life expectancy for women and men
|
Central Statistical Office
How to interpret the data? The Central Statistical Office points out that based on the examples in the table, it is impossible not to notice that on average a person aged 65 would live to be 83 years old, while a person aged 70 would live to be 84 years old. “For many, it may be incomprehensible why the average life expectancy for a younger person is shorter than for an older person. This is consistent with the commonly used methodology for calculating average life expectancy and results from the fact that Surviving each year increases the chance of living to an increasingly older age. – explain representatives of the office.
How do the Central Statistical Office tables affect the amount of the pension?
Life expectancy tables are a key element in the pension calculation system in Poland. The Social Insurance Institution divides the capital accumulated by the future retiree by the expected number of months of life.
The mechanism is simple: the higher life expectancy, the more months of payments, and the more months, the lower the monthly pension.
See also: The attitude of a “monument” and unnecessary data in your CV. The 50-plus generation sabotages its chances in recruitment
Who will feel the changes the most?
Changing plates most affects people who:
- will reach retirement age and retire after the new tables are introduced,
- have accumulated retirement capital and plan to end their professional activity in the near future.
The calculations of “Fakt” show that seniors can lose PLN 200-300.
Nothing changes for people already receiving a pension — new tables do not affect benefits already granted.
What does this mean in a broader context?
The increasing values in the tables show a positive trend – Poles are living longer and longer. This is the effect of, among others, better medical care, improved quality of life and greater health awareness.
From the perspective of the pension system, however, this means a greater burden – benefits are paid over an increasingly longer period of time. For future retirees, this is a signal that the moment of retirement has a real impact on the amount of the benefit.