
Poland is the runner-up in economic growth in the EU, inflation is the lowest in almost two years, and the golden race continues


2026-02-14 06:00
publication
2026-02-14 06:00
A lot happened – this is how you can sum up the past week. Inflation in Poland, the USA and China, but also a number of GDP data in the euro zone and beyond. For now, the Polish economy is on track, but the British are not so lucky. And the prices of donuts – because they are also worth mentioning. We invite you to a traditional summary of the week in charts.
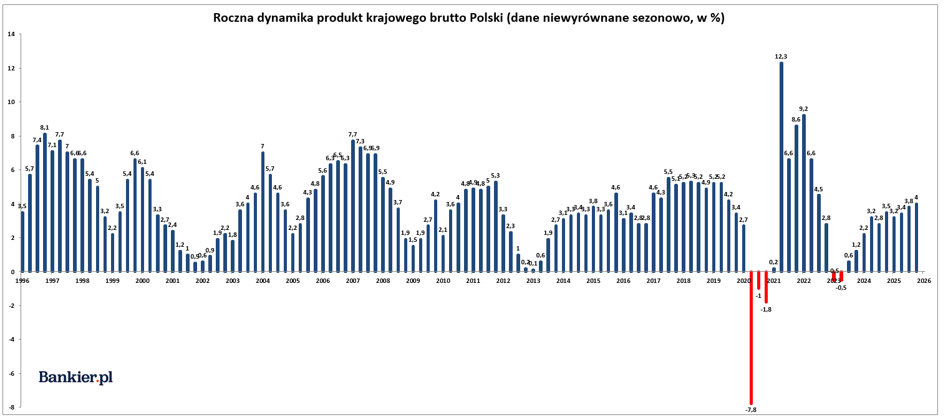
The Central Statistical Office has published the latest data on Poland's economic growth. After an excellent third quarter, the end of the year brought an acceleration in the annual dynamics. The result for the entire year 2025 confirms that the Polish economy, although it can afford more, is on the right track. Forecasts for 2026 predict an acceleration in the growth rate.
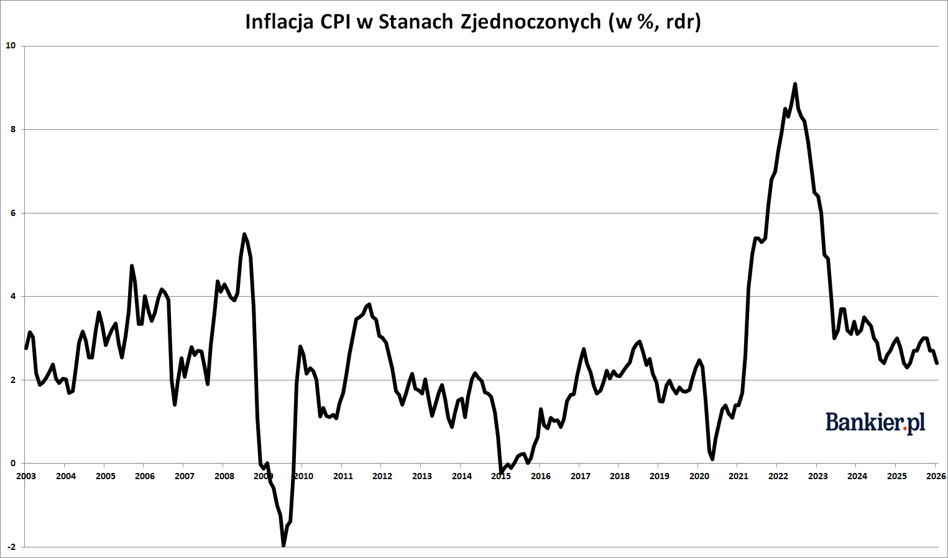
January brought a deeper than expected drop in CPI inflation in the United States. This is good news for holders of financial assets because it paves the way for further interest rate cuts from the Federal Reserve.
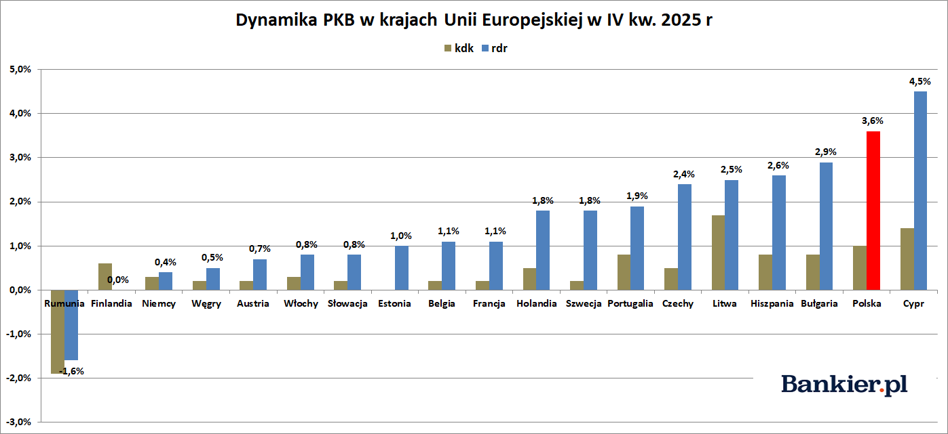
In the last quarter of last year, Poland recorded the second highest annual GDP dynamics in the European Union countries. In this comparison, I omit Ireland, where gross domestic product statistics do not reflect the state of the real economy.
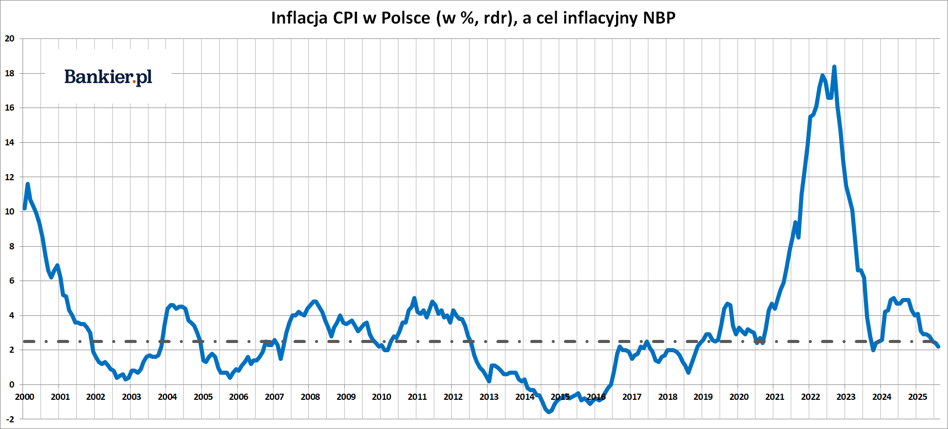
Due to the effect of last year's high reference base, CPI inflation in January 2026 was the lowest in almost two years – according to the latest data from the Central Statistical Office. However, in a month this result will be subject to a routine annual review.
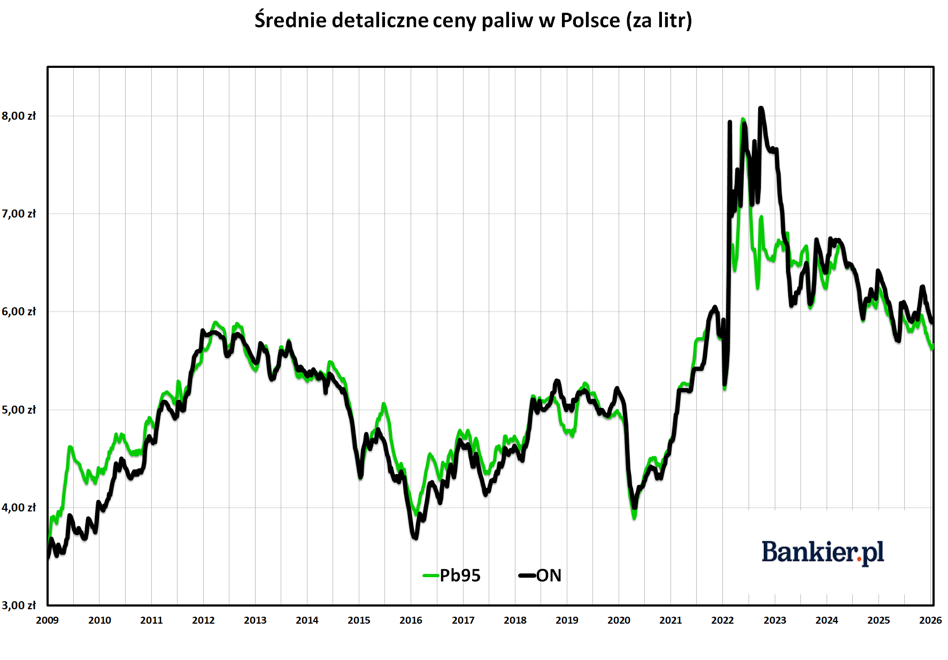
The second week of February brought stabilization of retail fuel prices in Poland. The situation on global stock exchanges also calmed down, where gasoline and diesel prices stopped rising so quickly.
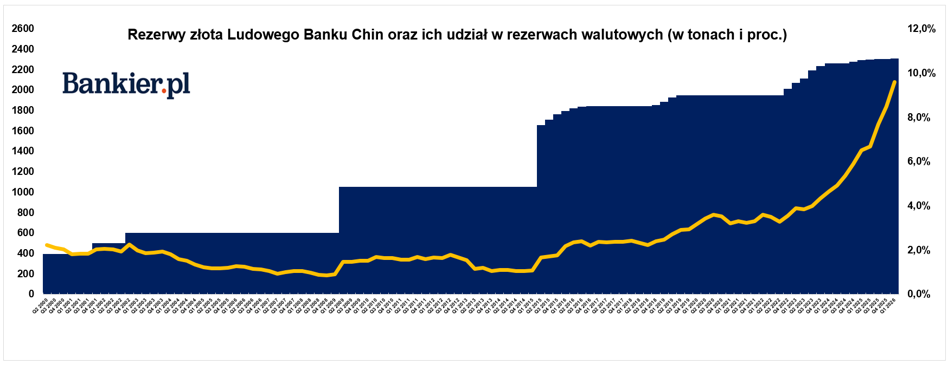
Nearly 1.25 tons of gold was purchased by the People's Bank of China in January 2026, according to the latest data. This means an increase in the pace of purchases of the royal metal compared to the previous three months and the 15th consecutive month of consistent increase in reserves. The previous shopping series lasted even longer.
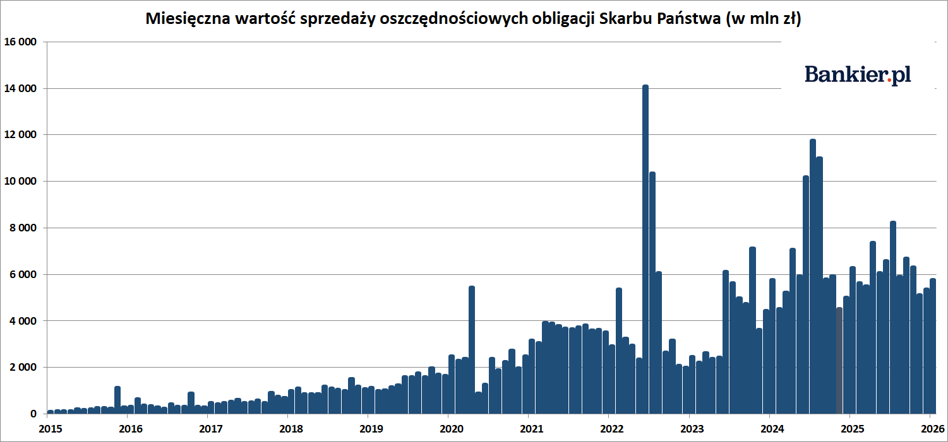
The beginning of 2026 saw continued solid sales of retail Treasury bonds. Poles lent the government almost PLN 5 billion net, despite increasingly lower interest rates offered by Polish treasury securities.
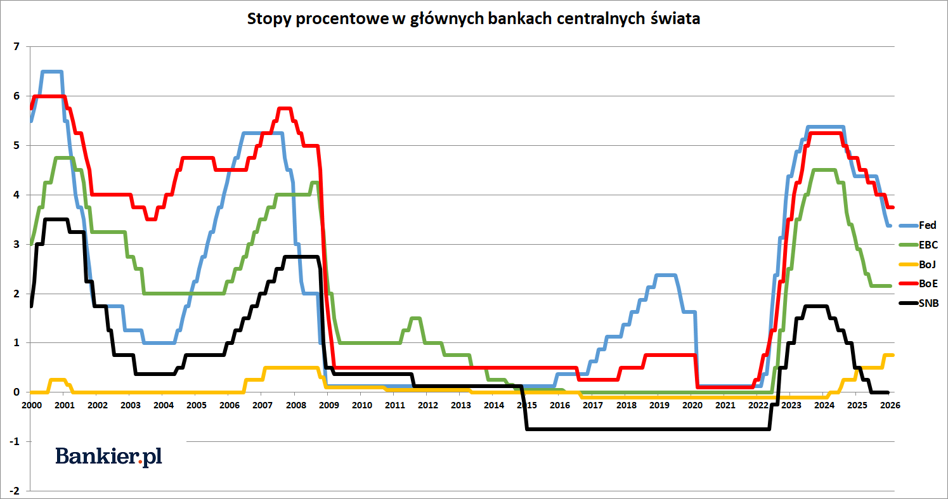
The Reserve Bank of Australia was the first Western central bank to decide to increase interest rates after the monetary easing cycle. This raises the question of whether this is a matter of Australian exceptionalism or the beginning of a reversal of a global trend.
Round one hundred years ago – on February 10, 1926, Gdynia obtained city rights. On the anniversary day, we check how the Gdynia real estate market has changed in recent years. The conclusions for those looking for apartments – whether to buy or rent – are not optimistic. Although last year was marked by stabilization, in the long term Gdynia is facing one of the highest increases in rent rates and amounts paid for new apartments.
January was the fifth month in a row in which the average asking price of rents for the most popular apartments in Warsaw decreased – according to Otodom Analytics data. The same series takes place in Kraków and Gdynia, and in the case of studio apartments also in Gdańsk and Wrocław. All this means that in the case of the largest cities we are talking about lower rent prices than a year ago.
The worst opening of the year for car showrooms in three years. Sales of new passenger cars decreased by 9% year-on-year. However, three things have not changed compared to last year. This is Toyota's dominant position and the still high popularity of electric cars and “Chinese” cars.
|
Registrations of new passenger cars in Poland in January 2026. – the most popular models among Polish individual customers |
||
|---|---|---|
|
No. |
Model |
Number of registrations |
|
1. |
Toyota Yaris Cross |
536 |
|
2. |
Volkswagen T-Roc |
533 |
|
3. |
Toyota C-HR |
483 |
|
4. |
Kia Sportage |
443 |
|
5. |
Toyota Corolla |
437 |
|
6. |
Toyota Aygo |
404 |
|
7. |
Toyota RAV4 |
394 |
|
8. |
Hyundai Tucson |
382 |
|
9. |
Toyota Yaris |
379 |
|
10. |
Toyota Corolla Cross |
356 |
|
11. |
Skoda Kamiq |
338 |
|
12. |
Cupra Formentor |
332 |
|
13. |
MGHS |
309 |
|
14. |
Volkswagen T-Cross |
305 |
|
15. |
Dacia Duster |
294 |
|
16. |
Omoda OMODA5 |
285 |
|
17. |
Dacia Sandero |
242 |
|
18. |
Volkswagen Tiguan |
238 |
|
19. |
Renault Captur |
236 |
|
20. |
MG ZS |
231 |
|
Source: Polish Automotive Industry Association |
||
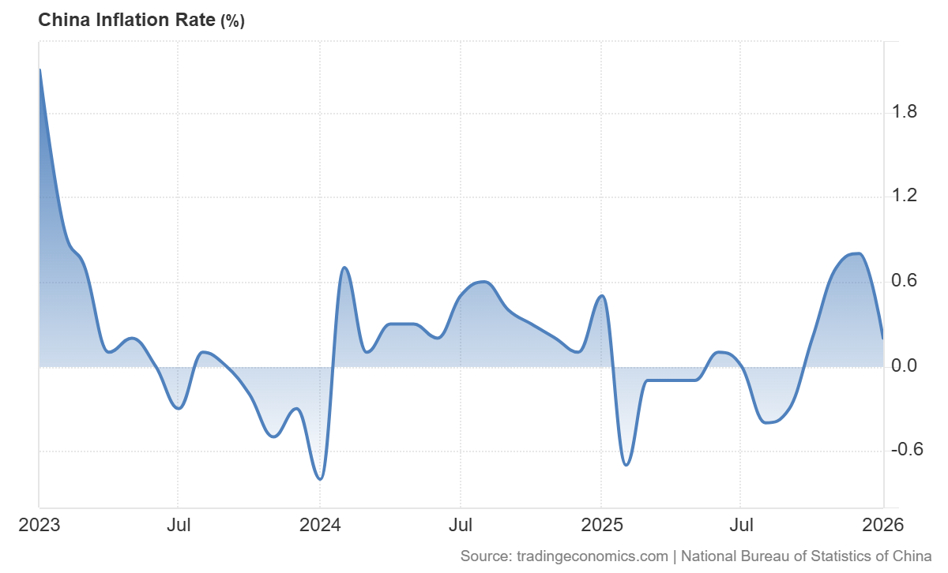
The January inflation reading from the Middle Kingdom brought another cold shower to investors. The dynamics of consumer prices (CPI) unexpectedly slowed down, missing economists' forecasts. Producer prices continue to fall, confirming that the Chinese economy continues to struggle with deep structural problems and weak domestic demand.
Fat Thursday is the one day of the year when a donut ceases to be just a sweet snack and becomes the most important economic indicator in Poland. Even though the prices of raw materials have fallen, we will not be greeted with a pleasant surprise at the checkout. What is the Donut Index in 2026 and how much do we have to work for one piece of traditional pleasure? Check the analysis of Bankier.pl.
|
Donut Index 2026 |
|||
|---|---|---|---|
|
Donut price – 2026 |
Donut Index 2026 |
Donut price – 2025 |
Donut Index 2025 |
|
PLN 0.69 (promotional) |
5226 |
PLN 0.49 (promotional) |
6655 |
|
PLN 2.5 (markets) |
1442 |
PLN 2.2 (markets) |
1482 |
|
PLN 5.5 (bakeries) |
655 |
PLN 4.5 (bakeries) |
725 |
|
PLN 12 (handicraft) |
300 |
PLN 10 (handicraft) |
326 |
|
PLN 26 (“celebrity”) |
138 |
PLN 22 (“celebrity”) |
148 |
|
Source: Bankier.pl |
|||
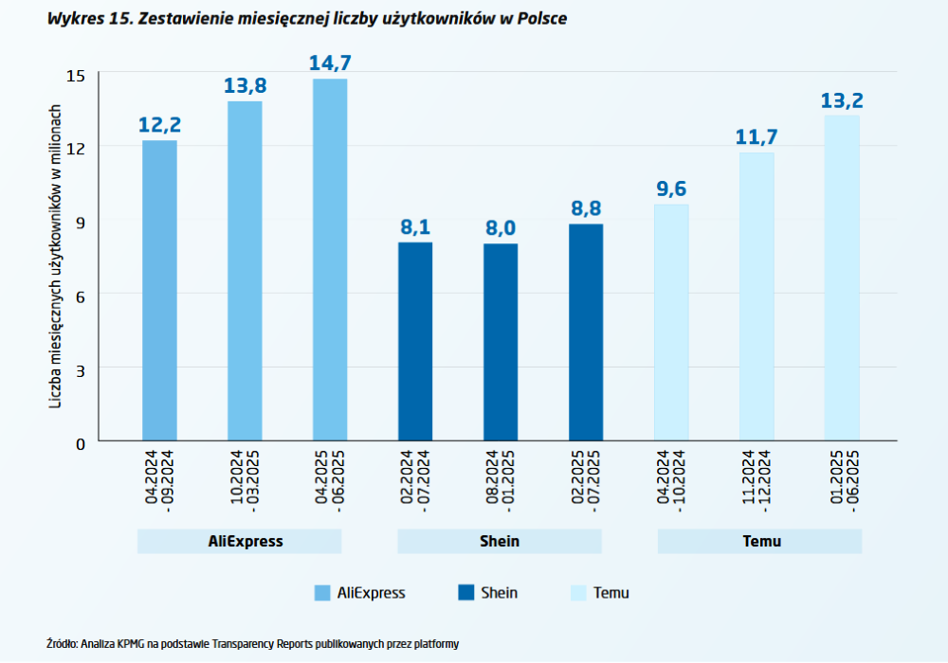
The offensive of Chinese sales platforms continues to gain strength. In 2025 alone, brands such as Temu, SHEIN and AliExpress spent millions of zlotys on advertising on Meta's websites, and marketing activities are gaining momentum. What does Temu's biggest competitor, Allegro, look like in this context? Have the advertising expenditures of Chinese brands translated into revenues and the number of users?
Prepared by JM


