“Foreign trade turnover in January – July 2025 was at current prices PLN 887.2 billion in exports and PLN 901.6 billion in imports” – results from the Monday publication of the Central Statistical Office.
It means Negative foreign trade balance at PLN 14.5 billion. So much more were worth goods brought to Poland from abroad, compared to what we sent to other countries.
See also: 13. Free salary. You must have so much savings to make it possible without risk [TABELE]
The Central Statistical Office indicates that compared to the same period of 2024. Exports dropped by 0.3 percent, and imports increased 10 times harder-by 3.1 percent.
Foreign trade. Poland's most important partners
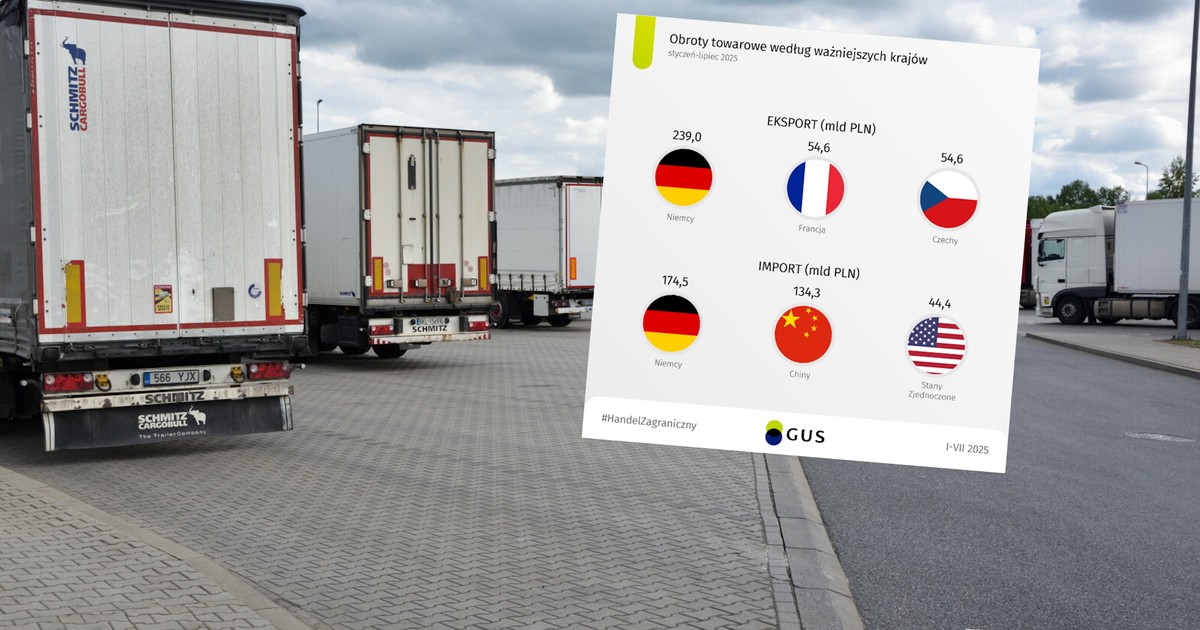
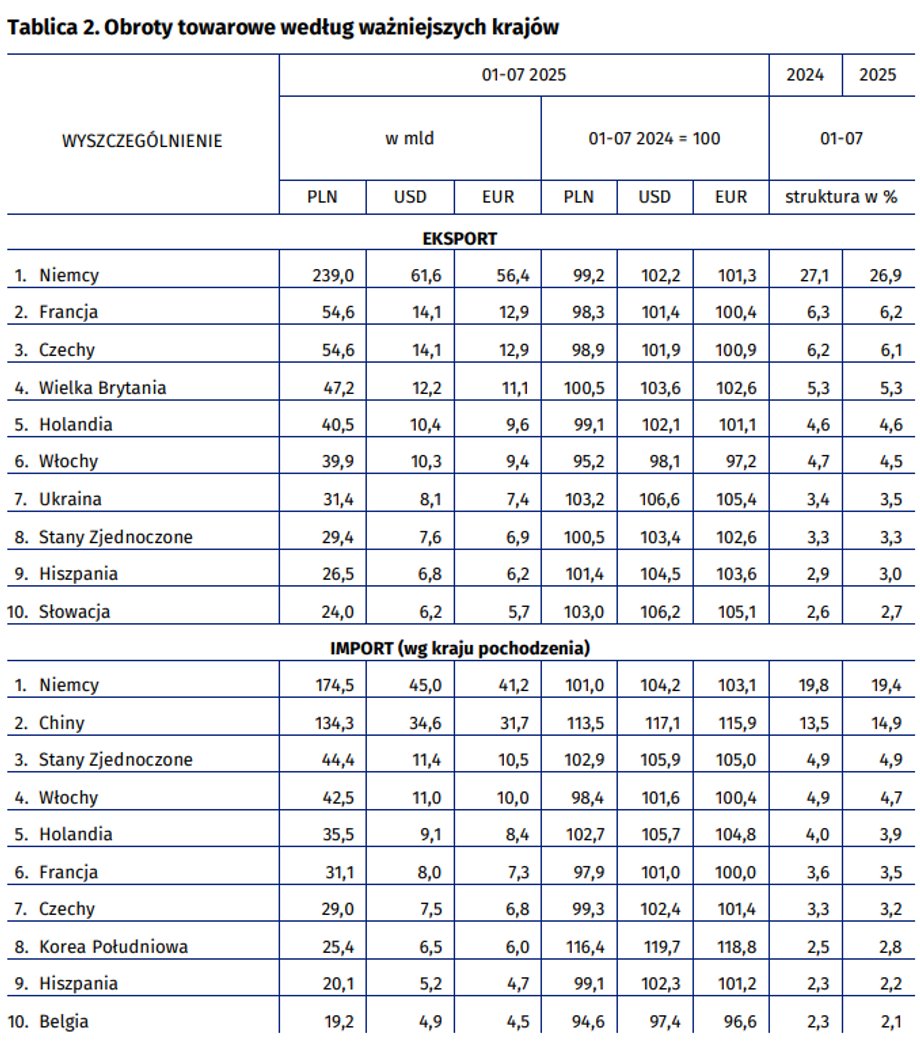
Traditionally The most important sales partner of Poland is Germany. They are a definite number one among all countries from which we import goods and to which we export. In the first seven months of this year, our balance was very positive, because we sent our western neighbor goods for PLN 239 billion, and at the same time imports amounted to PLN 174.5 billion.
See also: Trump's duties effect. German exports to the USA reached the lowest level in four years
Exports to Germany in the analyzed period was four times greater than to France and the Czech Republic, which occupy second among our greatest partners.
Less disproportion is in import statistics, because the second in the China ranking sent goods worth over PLN 134 billion to our country. The United States is left behind, from which imported PLN 44.4 billion.
Poland in foreign trade. What has changed?
In the period from January to July, Poland was recorded among the main trading partners of Poland increase in export to Ukraine (by 3.2 percent), to Slovakia (by 3 percent), to Spain (by 1.4 percent), to the United States (by 0.5 %) and to Great Britain (by 0.5 percent).
Imports have been increased turnover with South Korea (by 16.4 percent), China (by 13.5 percent), the United States (by 2.9 percent), the Netherlands (by 2.7 percent) and Germany (by 1 percent).
Turning with the top ten of our trading partners accounted for 66.1 percent. total exports (compared to 66.4 percent in the same period of the previous year), and total imports – 61.6 percent. (against 61.1 percent). The share of Germany in exports decreased by 0.2 percentage points. and amounted to 26.9 percent, and in imports fell by 0.4 percentage points to 19.4 percent
|
Central
Polish trade from the USA
According to the CSO data, it shows that The balance of turnover with the United States during the analyzed periods was negative and amounted to PLN 15 billion. Exports to the United States accounted for 3.3 percent. total exports, and imports amounted to 4.9 percent
See also: Problems with shipping packages to the USA. The Polish Post Office announces changes
“Goods from the mechanical industry had the largest share in the goods exchange in both imports and exports with the United States. Among the significant goods in export to the United States can also be mentioned Furniture, optical and photographic equipment and electric machines” – we read in the report.
Foreign trade. Detailed GUS data about goods
In Polish exports in the first seven months of 2025, growth occurred in the scope of goods and transactions not in SITC (by 31.4 percent), food and living animals (by 7.6 %), various industrial products (by 2.2 percent) and chemicals and related products (by 1 %).
The decrease concerned: mineral fuels, lubricants and derivative materials (by 21.9 percent), oils, fats, animal and vegetable waxes (by 16 %), inedible raw materials except fuels (by 6.1 percent), industrial goods classified mainly according to raw material (by 2.1 %), drinks and tobacco (by 2.1 %) transport devices (by 1.5 percent).
In import, increases were recorded in: goods and transactions not in SITC (by 54.8 percent), various industrial products (by 12.4 percent), food and living animals (by 9.7 percent), chemicals and related products (by 2 %), machines and transport devices (by 1.9 %), drinks and tit 1.8 percent) and industrial goods classified mainly according to raw material (by 1.5 percent).
The declines were observed in: mineral fuels, lubricants and derivative materials (by 16.8 percent), oils, fats, animal and vegetable waxes (by 3.5 percent) and inedible raw materials except for fuels (by 0.7 percent).


